Everything about Banff Weather: Average Rain, Snow & Temperatures
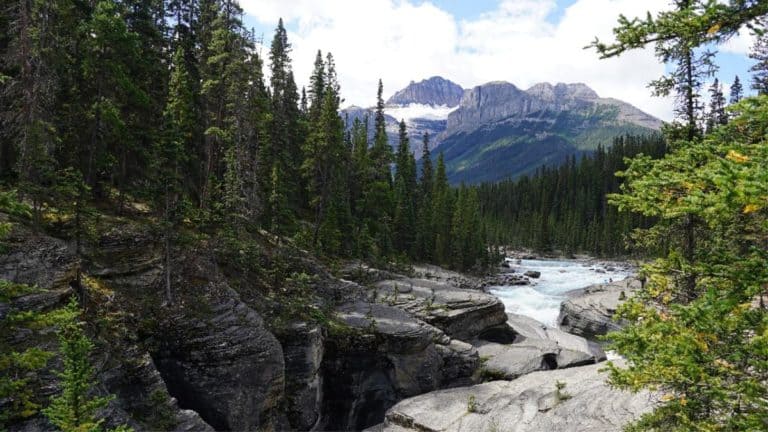
Banff National Park has a typical mountain climate, which guarantees unpredictable weather all year round. I mean, have you ever seen it snow in July? In an attempt to make sense of things and give you an indication of what type of weather to expect for your arrival at the park, I wrote this comprehensive post.
Snow in July. Yes, it happens. Temperatures well above zero in the middle of winter? Yup, happens too. Indeed, you never know what to expect. Still, Banff’s climate makes generalizations possible as well as give decent predictions of what to expect in what month.
Below, you’ll find monthly averages regarding rain, snow and temperatures. It could help you decide when you want to visit the park. Okay, let’s dive in.
Banff’s Climate
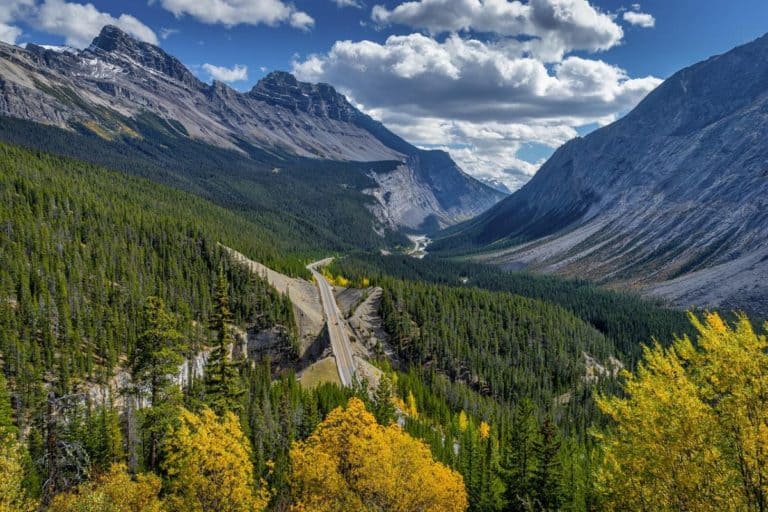
Banff experiences a subarctic climate bordering on a humid continental climate. It is known for its cool, short summers and long, cold winters. The graphs below illustrate this. This type of climate is typically found further away from (the moderating influence of) oceans.
Is Banff’s Climate Changing?
The answer to this question is yes. In their 2005 study, Daniel Scott and Brenda Jones of the University of Waterloo already concluded that the ‘mean annual temperatures have increased 1˚C since the 1940s […], with minimum temperatures showing the largest increase during this time’.
Based on data from the Banff Climate Station, they also concluded that Banff ‘on average receives less precipitation now than it did in the 1940s. Annual precipitation has decreased 5% since 1938. Annual natural snowfall has demonstrated substantial interannual variability over the last 70 years.’
Furthermore, in the Town of Banff’s Climate Resilience Action Plan it is stated that ‘the average annual temperature in the Bow Valley has increased by about +1.4C since the early 1900s, with winter months seeing greater warming than summer months. Over the same period, the amount and timing of precipitation in the area have also changed.’
There’s a lot to say about the influence of climate change on the park and its tourism. This website is not the proper place to do so. I’d better leave it to scientists to write about this subject.
If you want to read more about the influence of climate change on the park I recommend reading the post about wildfires in the park.
Banff Temperature by Month
The climate described above you can find represented in the graphic below. While many websites claim to have the average temperatures for Banff (they probably do), I ensured they are correct by taking the Banff weather data from the website of the government of Canada.
Below, you’ll find graphics on the maximum, the minimum and the mean temperatures, taken from data from the Banff Climate Station over the period 2000 – 2021. I also included the trend in average temperature in Banff over this period.
Some of the quick conclusions you can draw from these graphics:
- December is the coldest month (mean = -9.3˚C / 15.26˚F)
- July is the warmest month (mean = 15.1 ˚C / 59.2˚F)
- There’s a general upward trend regarding average annual temperature over the years 2000 – 2021
- The warmest year was 2016, with an annual mean of 4.18˚C / 39.52˚F
- The coldest year was 2002, with an annual mean of 1.54˚C / 34.78˚F
- The most snow falls in April
- The most rain falls in June


Snowfall in Banff
Banff is known as an excellent winter sports destination. The fact that three ski resorts within the park’s boundaries (Mount Norquay, Sunshine Village and Lake Louise) are testament to that. The centimeters of snow in the graphic below also give a good indication obviously.
How Much Snow Does Banff Get?
Getting exact data on this subject has been difficult.
To get a more contemporary image of the snow averages in Banff, I tried collecting the data from 2000 until 2021. However, the data for monthly snowfall were only available from January 2000 until December 2007, as represented in the graphic below.
Since then, climate change probably has affected these averages, as confirmed by the Town of Banff’s 2016 Climate Resilience Action Plan. It states that ‘warmer winters with less snow impact winter tourism such as ski areas and dog sledding’. The report also says that ‘since 1965, the amount of precipitation falling as snow has been declining at a rate of 122 mm per century’. This has resulted in a reduced winter snowpack.
Upon this report, it’s safe to assume that average snow levels have decreased since December 2007. Still, the graphic below can give you a general idea of how much snow Banff gets in what month and how big the differences between the months are.

Rainfall in Banff
Banff receives quite a bit of precipitation over the year. Expect rainfall in the (late) spring and summer months (see graphs).
Average Monthly Rainfall in Banff
I had the same data problem with rainfall in Banff as with snowfall (see subheading How Much Snow Does Banff Get?). Data are missing for the same period. Upon the data I did find, I created the graphic below.
It’s also safe to assume that average precipitation in the form of rainfall has increased over the past decade. The 2016 Climate Resilience Action Plan Recent states that ‘studies have demonstrated that extreme rainfall intensity increases by about 7% for every degree increase in global atmospheric temperature’.

What About Chinooks in Banff?
In Banff, temperatures can climb from well below zero to well above zero. This generally happens overnight, making snow melt rapidly. The discrepancy can be as big as 30 degrees Celcius (and sometimes even more!). This phenomenon is called a Chinook wind or Chinook.
It’s a dry, warm föhn wind in western North America. There are two: coastal Chinooks and interior Chinooks. The one in Banff is the interior Chinook.
Well, how do chinooks occur?
Originating on the Pacific coast, warm air rises to the top of a mountain range. It cools off and loses its moisture in the process. On the range’s leeward side, the dry air slides down. It starts to compress and warm up, going from freezing to 18 to 20˚C (64 to ˚68F). In the valley, it scoops back up, almost in a wave-like pattern. At this point, any leftover moisture condenses, which creates a cloud band parallel to the Rockies, known as the ‘Chinook Arch’.
Chinooks can last from several hours to several days and are pretty strong, reaching speeds of 30 to 50 km/h, sometimes even as much as 100 km/h.
Banff Temperatures in Fahrenheit
As Canada measures temperatures in degrees Celcius, forecasts for the area are also in degrees Celius. If you’re an American, this can be confusing as you’re used to Fahrenheit.
To get the temperature in the temperature scale you’re used to, multiply the Celcius temperature by 1.8 and add 32. That’s it.
Or just check your phone…
History of Banff’s Weather Station
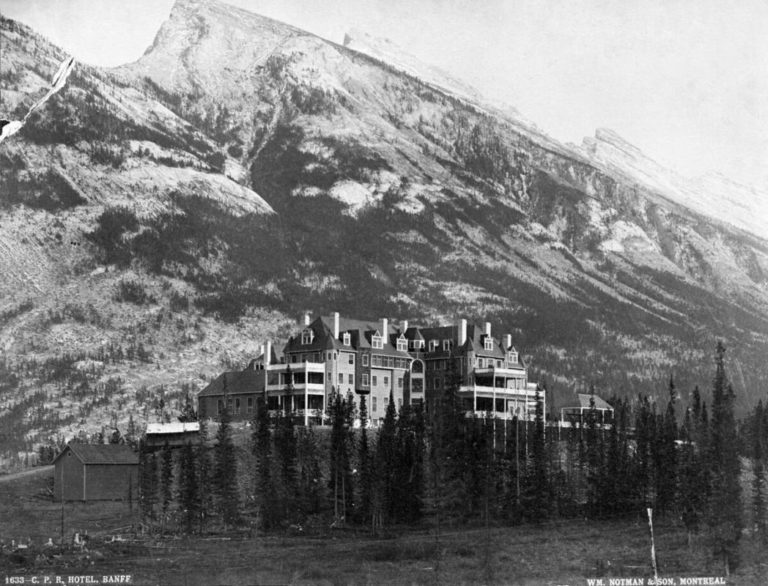
This post about the weather in Banff would not be complete if I wouldn’t tell you about the Banff Weather Station. It’s perched on the top of Sulphur Mountain at 2,283 meters (7,490 ft) and was built in 1902 to collect climatological data about the Bow Valley. The Toronto-born Norman Bethune Sanson, who had moved out west in the park’s early days, was the first meteorologist in charge of the weather station.
This recognized federal heritage building, built of indigenous materials, is also known as the Sulphur Mountain Observatory. It was in service until 1976. During this period, it collected a significant amount of climatological data about the climate in the Rocky Mountains.
When it was built, Banff National Park was only 17 years old. Then still known as Rocky Mountains Park, it quickly gained recognition as an excellent tourist destination. Promoted by the federal government, it had the station built to provide tourists with information.
Sources:
- Scott, D. and Jones, B. 2005. Climate Change & Banff National Park: Implications for Tourism and Recreation. Report prepared for the Town of Banff. Waterloo, ON: University of Waterloo.
- Town of Banff, 2016. Climate Resilience Action Plan.